The instructions below have been customized for your project "".
Customize these instructions for the project
Using traffic logs
One of the major features of redirection.io is to collect all the traffic logs for your website and display them in real time in the redirection.io manager graphical interface.
Using these logs, it is quite easy to spot issues and react by creating redirection rules. We will not develop here how much important it is to use your website's logs to understand if it works well - read more about our log features and why using your traffic logs is a good idea!
The logs explorer
When logged in the manager, open a project and head to the logs screen by hitting on the "Logs" menu item.
The interface of the logs explorer is divided into three main parts:
- a timeline, that allows to "zoom" on a specific time frame;
- the logs list itself. This list is highly configurable. For example, you can customize the displayed columns (by using the columns button

- the filters bar, which allows searching for specific log entries.

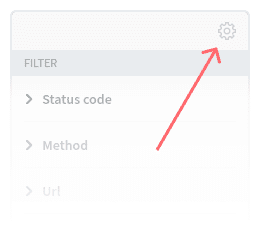
Filtering the logs
The logs explorer provides several filters, that allow to narrow the list of the requests displayed in the logs explorer. The following filters are available:
- request filters: these filters are based on the properties of the request
- Method: filter based on the HTTP method used for the request.
- URL: filter based on the full URL
- Host: filter based on the host of the request
- Path: filter based on the path of the request. This is useful to display all the requests made to a specific section of your website by ignoring query parameters. For example, you can filter all the requests made to
/products/by using the path filter with the value/products/, which will display all the requests made to URLs such as/products/?category=shoesor/products/item-123. - Query Params: whether or not the request URL contains query parameters.
- client filters: these filters are based on the properties of the client that made the request
- User agent: filter requests based on the specified User-Agent.
- User agent type: filter on the category of User-Agent. We categorize User-Agents under 4 types: Desktop clients, Mobile clients, Search engines, Tools and miscellaneous.
- IP Address: filter based on the IP address of the client that made the request. Note that IP address collection must be enabled in your project settings for this filter to be available.
- Country: filter based on the country of origin of the request.
- Client type: filter based on the connection type of the client that made the request. We categorize client types under 4 types: cellular (2G/3G/4G/5G), residential, business, and hosting provider.
- Referrer: if the Referrer was provided in the request, this filter allows you to search your logs based on this referrer.
- Referrer host: filter based on the host of the Referrer.
- response filters: these filters are based on the properties of the response
- Status code: filter the requests based on the status code of the response that is sent back to the user.
- Redirection: if a redirection was performed, filter on the value of the
Locationof the redirection - Content-Type: as redirection.io logs all the traffic of your website, you may want to filter based on the Content-Type of the response, to display only web pages (
text/html), for example. - Duration: filter based on the duration of the request, i.e. the time taken to process the request and send back a response to the client.
- technical filters: these filters are based on technical information related to redirection.io
- Instance: understand which redirection.io agent instance logged this request / response.
- Proxy: filter based on the proxy that processed the request.
- Has rule allows to filter the requests that triggered the execution of a redirection.io rule.
- Segment: this filter is available if segments are defined in your project. In this case, this filter allows you to filter the requests that matched a specific segment.
Request filters
Multiple filters apply to the request URL. While they may seem redundant, they each have their own use cases:
- The URL filter allows to filter based on the full URL, including the protocol, host, path, and query parameters. This is useful when you want to filter requests made to a specific URL, including query parameters in a specific order.
- The Host filter allows to filter requests based on the host only. This is useful when you want to filter requests made to a specific domain or subdomain, regardless of the path or query parameters.
- The Path filter allows to filter requests based on the path only. This is useful when you want to filter requests made to a specific page of your website, regardless of the host or query parameters.
Many times, using the Path filter is the most efficient way to filter requests made to a specific section of your website, as it ignores query parameters (in particular marketing query parameters) and focuses on the path only.
Response filters
Filtering based on response properties is a very powerful way to analyze your traffic, as it focuses on the outcome of the requests.
For example, you can use the Status code filter to quickly identify all the 4xx and 5xx errors on your website, or to check which pages are the most accessed with a success status (2xx).
You can also use the Content-Type filter to focus on specific types of content, such as HTML pages, images, or API responses (application/json).
The Duration filter is also very useful to identify slow requests that may impact the user experience on your website. You can filter requests that took longer than a specific threshold (e.g., 2 seconds) to identify potential performance issues. Hovering the duration values in the logs list also provides additional information about the different phases of the request processing: "redirection.io duration" (time taken by redirection.io to analyze the request) and "backend duration" (time taken by your backend server to process the request).

Combining filters
It is possible to combine filters to efficiently and precisely isolate requests. For example, you can check which 4xx errors Googlebot found during the last day, check which pages are the most hit with a success status under the /blog path, etc.
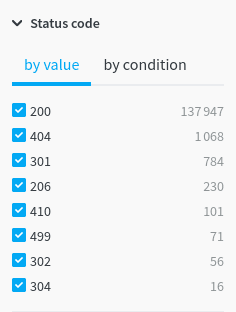
Each filter can be used in two ways:
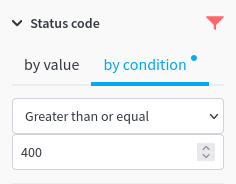


Note the red filter symbol that appears on the top right part of each filter when this filter is enabled: you can click this filter symbol to disable this filter in a quick way.
Using filters effectively requires understanding your traffic and knowing what you are looking for. Don't hesitate to experiment with different combinations of filters to get the insights you need from your logs. You can also load predefined log views that come with specific filter combinations to get you started quickly.
Logs rate and retention
Logs rate and quota
When redirection.io is deployed on a website, it collects all the traffic logs. However, the traffic data that we save is rate-limited based on your plan: 10k log lines/day for Free, 100k for Starter, and 2M for Pro. We allow temporary bursts, but we will drop log lines if your traffic consistently exceeds this limit.
When your project generates more logs than what it is allowed to, we will still count the associated requests and allow to display those in the traffic chart, but we will not store their detailed information. You will end up with a grey traffic chart:

Analytics data displayed on the project dashboard are computed based on all the logged requests, even those that are not stored due to daily overquota.
If you need an exhaustive view of your traffic data, we can higher the logging rate-limit for your project. Please contact us to get your daily logs quota increased.
Logs retention
The stored logs are kept during a period called the "logs retention" period. The duration of retention depends on the plan of the project:
- logs for "Free" projects are kept for 1 day, which means that you can get and inspect your detailed traffic logs for one day.
- logs for "Starter" projects are kept for 1 week (7 days).
- logs for "Pro" projects are kept for 2 weeks (14 days).
Starter and Pro projects can however have the logs retention period extended on demand - usually, SEO audits recommend to analyze logs over a complete search engine crawling window, which can extend up to two months.
We allow extending logs to several duration steps:
- 2 weeks
- 4 weeks
- 8 weeks
- 12 weeks
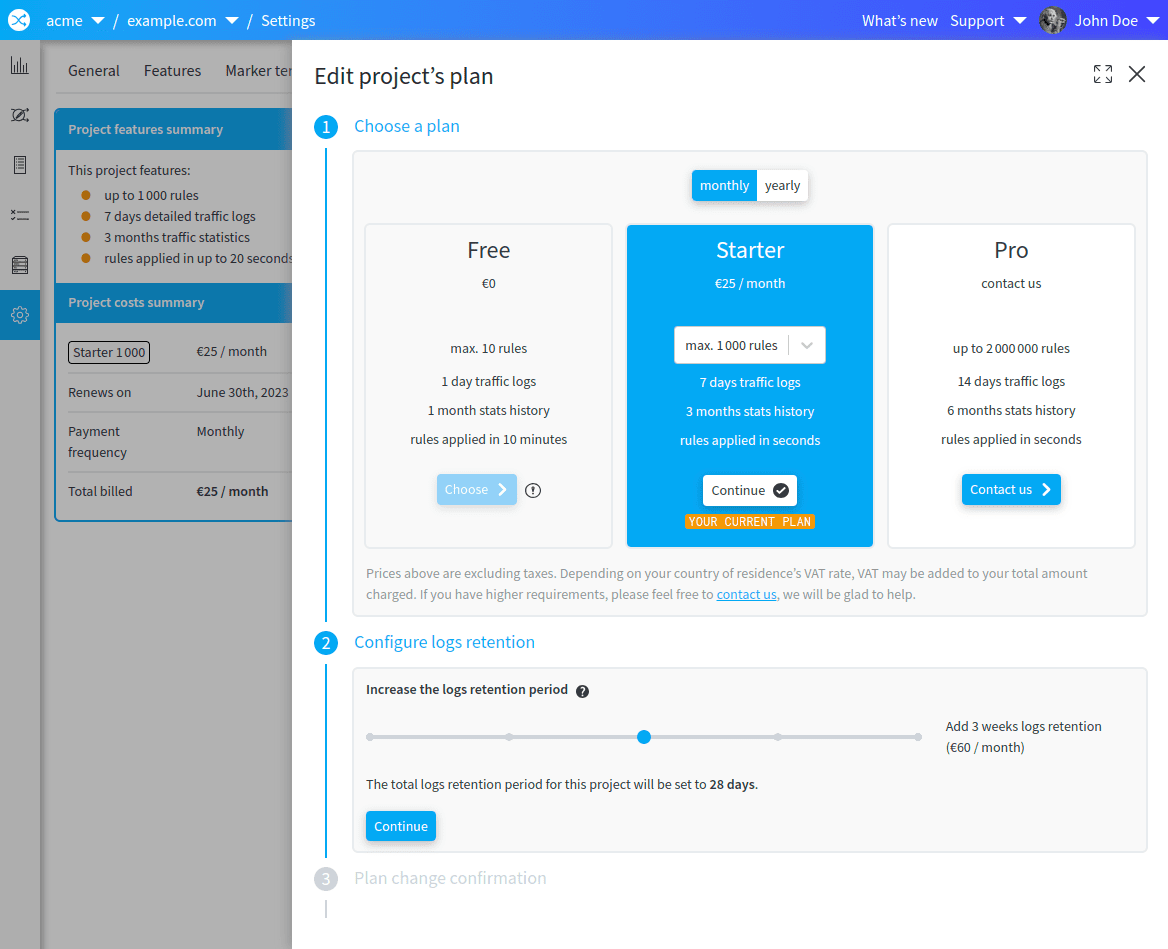
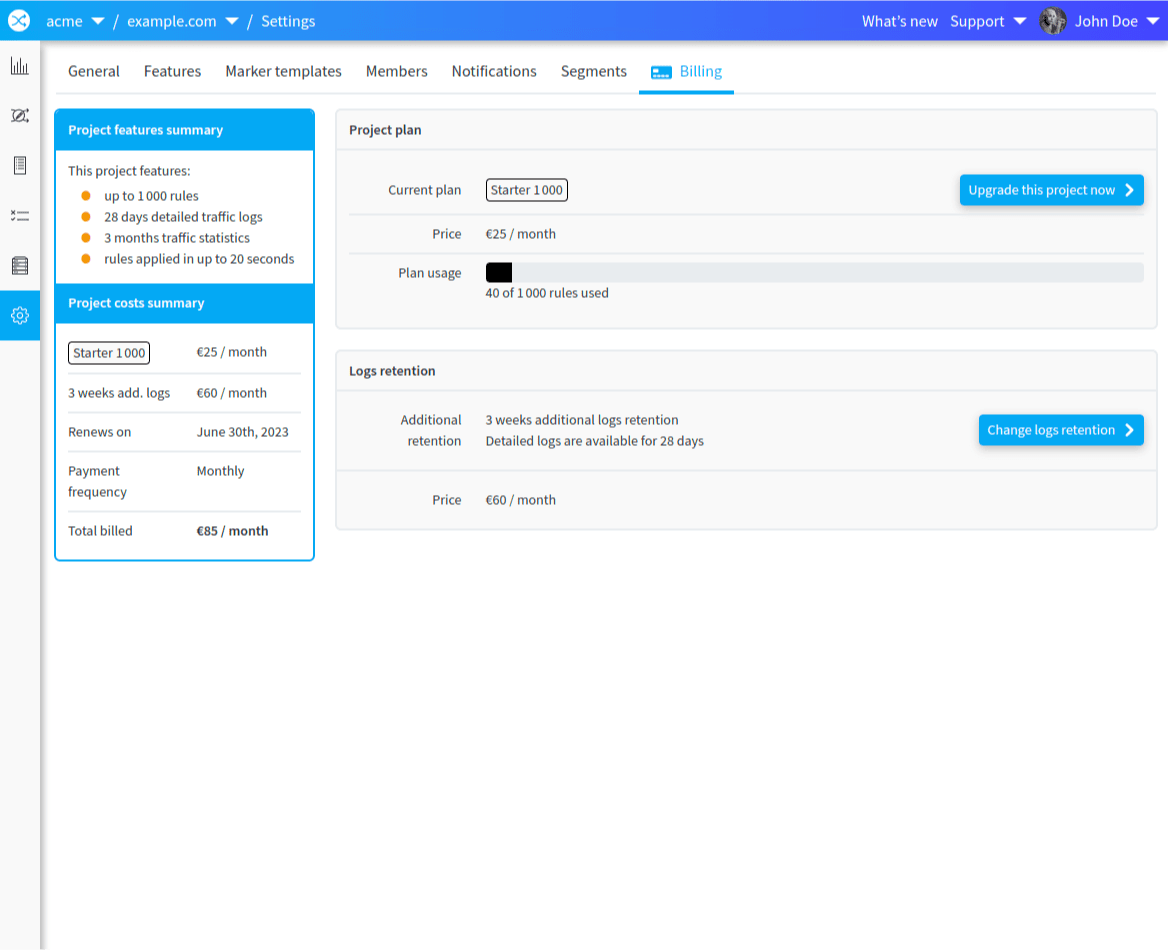
Starter project administrators can extend the logs retention period for their project directly in the manager, under the project billing section:


Pro projects administrators can simply contact their redirection.io dedicated account manager to discuss the logs retention extension. We will be happy to help!
Logs quota and retention pricing
If your project needs a higher daily quota, or a longer logs retention, or both, we can scale the limits of your project plan. Storing more logs, or for a longer period, is a project addon that is billed as an option to your subscription plan:
- longer logs retention can be configured for all paid plans (Starter and Pro)
- higher daily quota can be configured for Pro plans.
Please contact us to get your quota and retention modified. We don't have a public price list for additonal logs, as it decreases according to the maximum number of log lines stored in your project at a given time. As an indication, the monthly prices for additional logs ranges from €0.54 to €1.25 per million log lines stored. For example:
- 10M daily logs, stored for 1 month, cost around €0.83 per million log lines.
- 2M daily logs, stored for 2 months, are billed at approximately €1.07 per million log lines.
Grouping the logs
It is also possible to count the requests that match given criterions, using the "Group by" feature. It is possible to group requests by:
- URL: this will display the top-100 URLs that match the selected filters, along with the number of times such requests occurred
- HTTP method: see which HTTP methods were used on your website, and how many times
- Status Code: see the distribution of status codes across the responses sent by your web platform
- User Agent: see which user agents are hitting your website most
- Instance and Proxy allow to see the distribution of the requests handled by your redirection.io agents and proxies.
Like with filters, it is possible to group requests using multiple groups. For example, grouping both by HTTP Method and Status Code will show which pairs (method / status code) are the most frequent.
Logging IP addresses
By default, redirection.io does not log visitors IP addresses. However, this can be enabled by project administrators in the project settings:

Once IP addresses logging is enabled, you'll get more filters in the logs screen, and the ability to geolocate visitors. Pro plan customers also have access to a traffic map:

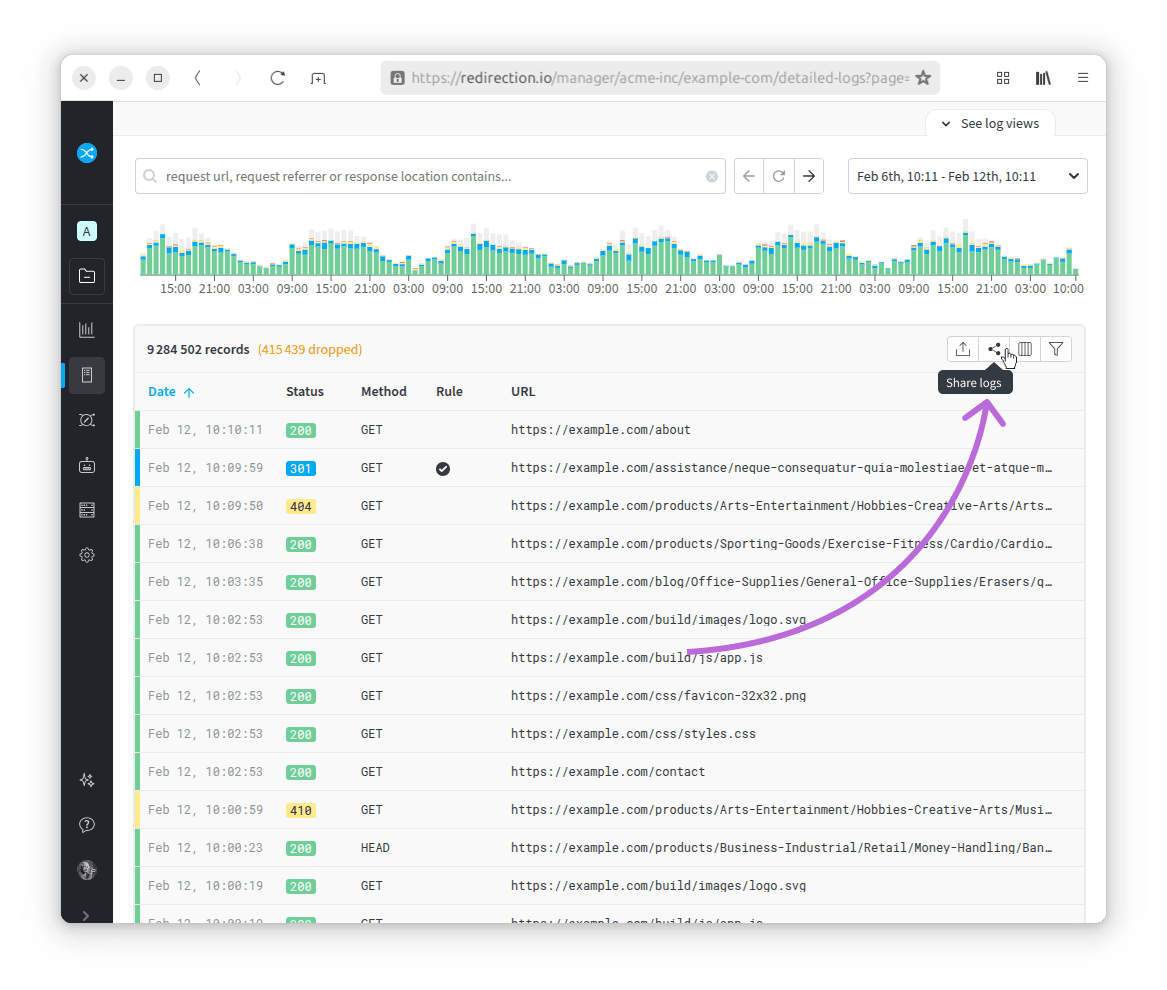
Exporting traffic log entries
Once you have narrowed the logs list using filters, and arranged the displayed columns as you wish, you can export this list as a CSV file using the "export" button, on the top right corner of the logs list: 
We do not set a limit on the amount of log lines that can be exported in this way, so you can use external tools to process and analyze the traffic statistics.
Googlebot requests validation
The categorization of the user agents and bot names that perform requests against your web platform is based on the User-Agent HTTP header, which is very often faked. Many bots, spiders, crawlers or automated tools, for example, use the Googlebot user agent, in order to avoid being blocked, instead of using their real name.
By default, we strongly validate requests that come with the "Googlebot" User-Agent, and categorize such requests into three groups:
- Googlebot: requests that are really performed by Googlebot are marked with the
Googlebotuser agent - Googlebot (other): requests that are performed by Google systems, but not by Googlebot, are tagged
Googlebot (other). This can be for example Adsense, Adsbot, Feedfetcher, etc. Google provides a list of its bots - Googlebot (unsure): requests that are performed on your website and announced as "Googlebot", but not performed by Google, are marked as made by
Googlebot (unsure). This is a convenient euphemism to avoid tagging such requests as "fake". If you receive many requests with such a user agent, it might be possible that some crawler spoofs the Googlebot user-agent to crawl your website.
This Googlebot validation feature is not designed for security reasons, but to help you analyze more precisely how Google crawls your website, and make sure that an analysis focused on the requests made by Googlebot is perfectly precise, exhaustive, and not "polluted" by other bot requests.
Log views
While the redirection.io logs explorer is snappy and offers many options, it can become annoying to repeat the same filters configuration to get a specific report. For example, if your weekly website monitoring routine includes checking the HTTP errors found by search engines, you could end up being a bit fed up with configuring again and again the "Status code" and "User agent type" filters.
For such cases, we offer the "Logs views" feature. Logs views are a way to save a specific columns, filters and groups configuration and to be able to reload this configuration with as few clicks as possible.
redirection.io proposes by default several predefined "Logs views" that address common analysis use cases, but you can define your own log views, that will be saved at the project level so you and your colleagues can use them.
To load an existing logs view:


This opens the "Logs views" lateral panel, where you can see all the available log views.

Each log view comes with several information:
- the name of the view
- a description
- an occurrence chart
- the properties of the view (columns displayed, sort criteria, filters, groups, etc.)
- an actions button bar, which allows to:
- select and load the view using the check button

- mark the view as a "favorite" using the start button

- custom views, that have been created in your project specifically, can be edited


- select and load the view using the check button


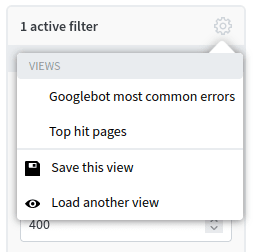
Views marked as "favorite" are displayed at the top of the list, in alphabetical order. They can also be loaded directly by hovering the gear wheel at the top of the filters bar.
The log entry detail panel
When no group is active, log lines can be clicked to display all the request details in a dedicated lateral panel:

This panel contains some helpful shortcuts:
- the "open" button allows to open the link in a new window:

- the "create rule" button opens the rule creation form, with the "Source URL" already filled with this URL:

- hover on the log properties: this allows to enable a filter on this value, to display all the similar requests:


Public sharing of logs
Sometimes you may want to share logs with a third party, but you don't want to give them access to your entire redirection.io project. In this case, you can use the "public log sharing" feature, which allows you to make a specific view of your logs public over a given period.
To share logs:
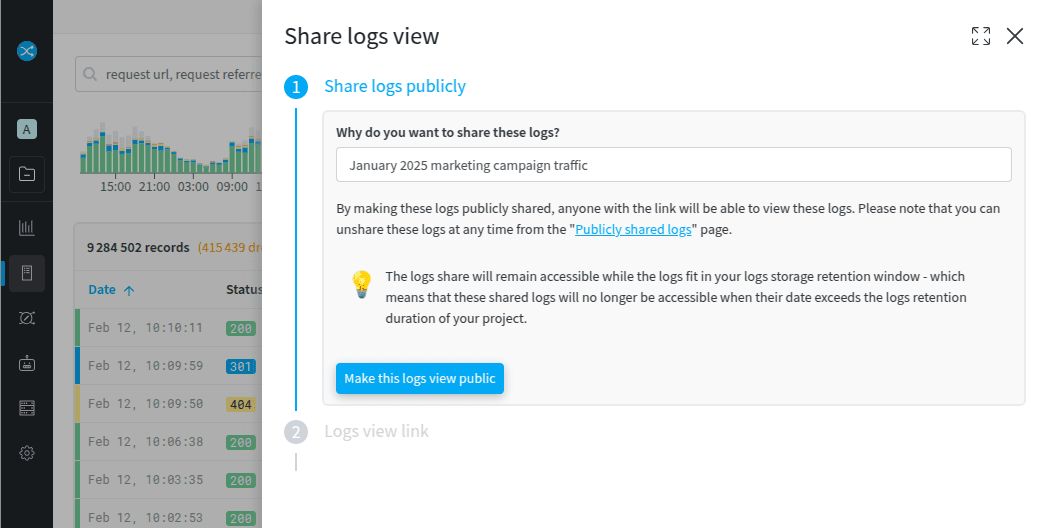
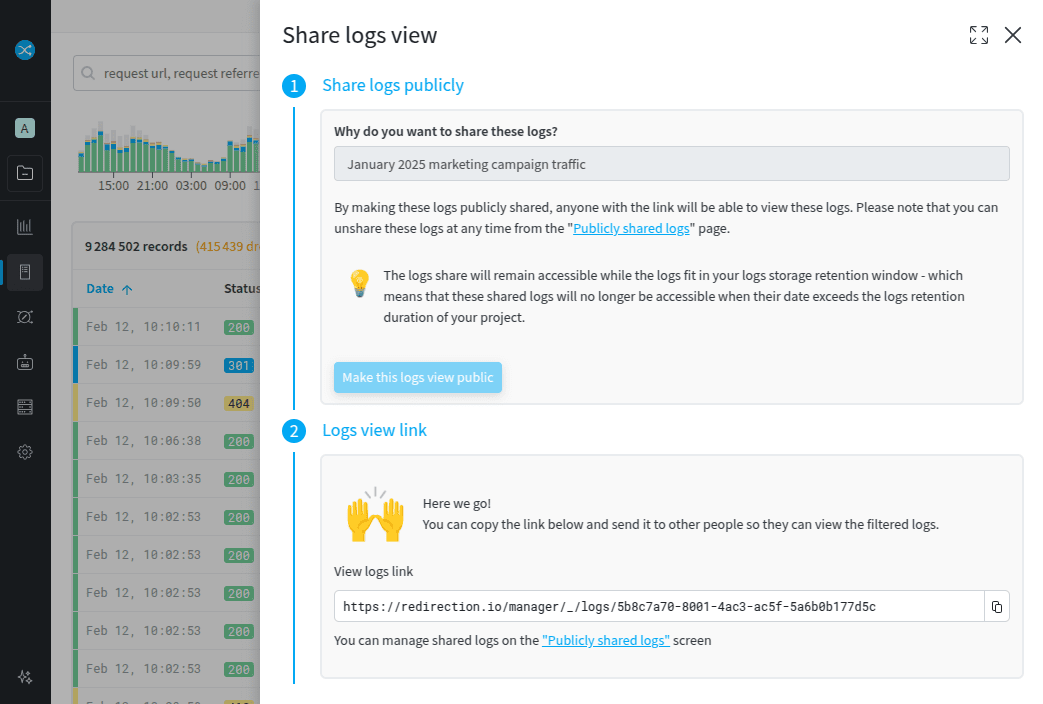


This view is read-only, and the person to whom you share the link will not be able to make any changes to your redirection.io project. It is not possible to edit the timeframe of the shared logs, to change the filters applied to them or the columns displayed. In other words, the shared logs are displayed as they are at the time of sharing.

In addition, shared logs are accessible to anyone who owns the link, so it is recommended that you do not share sensitive data in this way.
Active log shares are visible on your project's "Publicly shared logs" page, where you can view or delete them at any time. Shares are automatically deleted 7 days after the sharing period has expired.