Why is Logging so Important?
Are you sure that your website is always up and running? That none of your visitors stumbs upon a 404 error page, a 500 or any other usability problem? Logs are useful, because they record the activity of your users and give insights into the possible errors and failures. They give an elaborate sequence of events, including a detailed timestamp, that occasioned or led to an incident.
Analyzing log files can help developers troubleshoot issues with their applications and write better code. Also, SEO managers can optimize the user experience and the content availability for search engines, and DevOps / Sysadmins can make sure that the platform is delivering at its full potential.
redirection.io comes with unique HTTP live logging features, which help find the bottlenecks in the traffic of a website, and improve the overall customers experience. This is done in real time, and does not require to load and analyze web server traffic logs afterwards through a costly and reluctant process. Instead, we provide all the tools to better get insights from the traffic, isolate issues and fix them right away with our rules engine. Stop running your web platforms in the dark, use our tools to improve your efficiency!
Understand your traffic with redirection.io logs
redirection.io provides a comprehensive HTTP traffic logging solution, designed to help you monitor, analyze, and optimize your website's performance with ease.
- Log all the HTTP traffic
- Filter logs, group log lines
- See logs in real-time
- No need to manually import logs
- Filter logs by request location
- Easily spot HTTP errors
- Exhaustive CSV and JSON exports
- Get the details for each log line
- Check the shape of your traffic
- Display logs on a map
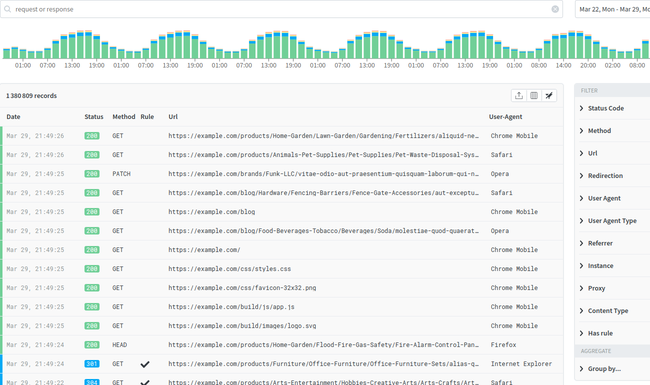
Log all the HTTP traffic
Once installed on your website, redirection.io logs all the HTTP traffic and makes it discoverable, in real time.
You can either use it for checking that the traffic shape looks good, or to search for traffic errors and fix them with traffic rules, using the manager.
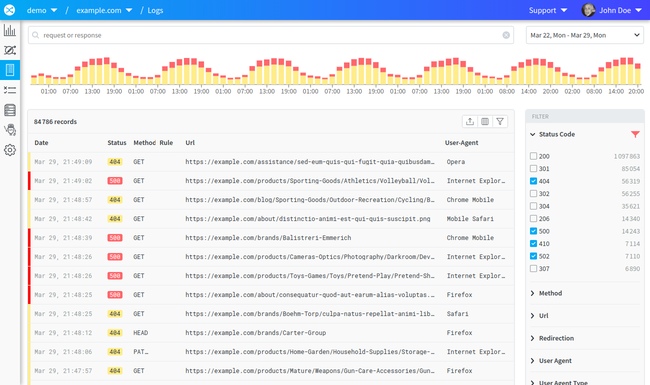
Filter, group and analyze logs
The raw logs output can be filtered to isolate particularly interesting aspects of the web traffic. It is possible to filter by status code, method, redirection target, user agent, client IP address (if IP address logging has been enabled), referer, content-type and other filters.
It is also possible to group the log entries using one or several properties. Want to know the top 100 404 or 500 errors hit by Googlebot last week? We have the tool for it!
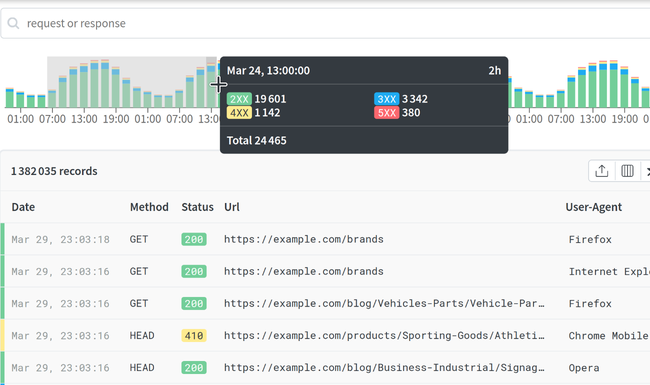
Explore the logs timeline
The logs timeline allows to identify traffic errors in a couple of seconds. It is also helpful to zoom on inhabitual events areas in a quick way.
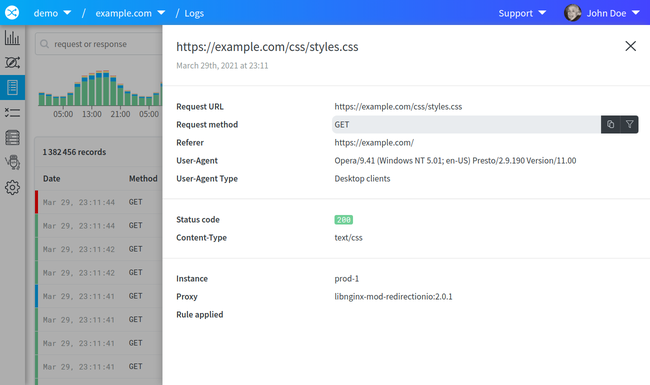
View details for each traffic hit
Each log entry is available as a detailed sliding panel and can be turned into additonnal filters. Want to see more logs like this one? Each of the request properties can be turned into a filter for the logs list, in a single click.
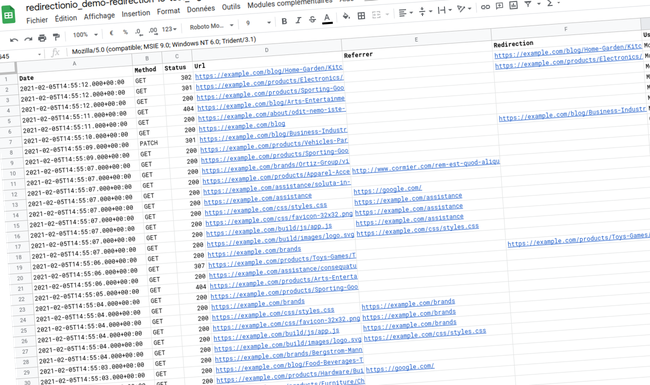
Export logs like a boss
The logs explorer allows to export in CSV as many log lines as you want, using the filters used in the logs view. The exports logs can then be re-imported in the tool of your choice, or analyzed using Excel, Google Spreadsheets or OpenOffice.

redirection.io provided us with the perfect solution for our domain migration needs. Its bulk import feature and user-friendly interface made the process seamless and efficient, saving us time and avoiding potential errors.
View other features
Log all the traffic
Collect all the HTTP traffic of your website, get insights and reports, and easily spot errors. Receive the weekly digest every monday, to make sure your website is working well.
Setup redirections
Configure redirects for marketing purpose, to fix moved content, to redirect a user based on his location, and more.
Advanced SEO rules
Use triggers and actions to perform SEO improvements in a matter of clicks!
Override SEO metadata in seconds, or push structured data in your website.
Performance matters
Our solution is built with a strong focus on performances. Discover how to scale your redirection.io usage, to serve hundreds of thousands of redirections.
Crawler included
Our full-featured crawler is available directly within the redirection.io manager. Discover issues and fix them right away with the same platform!
Security and resilience
redirection.io has been designed and built with security and resilience concerns in mind. The architecture of the platform offers the best security and reliability for your project.
Imports and exports
redirection.io allows to import and export your traffic data and project rules in a very fast and intuitive way as exhaustive CSV and JSON files.
Generate redirect rules
When redesigning a website, you will likely need to set up redirects from old to new URLs. Our redirect map generator creates redirect rules based on semantic proximity and link hierarchy.