Logs views, a faster way to explore your traffic logs
While the redirection.io logs explorer is snappy and offers many options, it can become annoying to repeat the same filters configuration to get a specific report. For example, if your weekly website monitoring routine includes checking the HTTP errors found by search engines, you could end up being a bit fed up with configuring again and again the "Status code" and "User agent type" filters.
For such cases, we offer the "Logs views" feature. Logs views are a way to save a specific columns, filters and aggregation configuration, and to be able to reload this configuration with as few clicks as possible.

We already several predefined "Logs views" that address common analysis use cases:
- All HTTP errors: This report displays the list of all HTTP errors (both
4xxand5xx). Use this view to spot issues peaks during the last logging period. - Googlebot verified requests: This report lists all the requests that have been performed by Googlebot or any other Google-operated bot. We have validated this request and filtered out third-party bots pretending to be Googlebot.
- Googlebot most common errors: This report shows the most common HTTP errors encountered by verified Googlebot on your website. Whenever possible, you should try to solve these issues by setting up a new redirect rule.
- Fake Googlebot: Lists all requests that have been sent using the "Googlebot" User-Agent, but that we identified as obviously not initiated by Google services. It may be that these requests are performed by third-party bots that try to scrape some content from your website.
- Most common HTTP errors: This report lists the top 100 most common HTTP errors (both 4xx and 5xx), grouped by URL and status code. The errors are sorted by occurrence count.
- Top hit pages: Displays the most frequently hit URLs that serve html content.
You can also define your own log views, that will be saved at the project level, so you and your colleagues can use them.
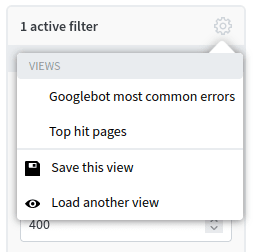
Loading an existing "logs view" is a one-click operation:


📖 You can read the full documentation about log views in the dedicated part of our user documentation.